


Abstract
Identification of clinically actionable molecular subtypes of pancreatic ductal adenocarcinoma (PDAC) is key to improving patient outcome. Intertumoral metabolic heterogeneity contributes to cancer survival and the balance between distinct metabolic pathways may influence PDAC outcome. We hypothesized that PDAC can be stratified into prognostic metabolic subgroups based on alterations in the expression of genes involved in glycolysis and cholesterol synthesis.
We performed bioinformatics analysis of genomic, transcriptomic, and clinical data in an integrated cohort of 325 resectable and nonresectable PDAC. The resectable datasets included retrospective The Cancer Genome Atlas (TCGA) and the International Cancer Genome Consortium (ICGC) cohorts. The nonresectable PDAC cohort studies included prospective COMPASS, PanGen, and BC Cancer Personalized OncoGenomics program (POG).
On the basis of the median normalized expression of glycolytic and cholesterogenic genes, four subgroups were identified: quiescent, glycolytic, cholesterogenic, and mixed. Glycolytic tumors were associated with the shortest median survival in resectable (log-rank test P = 0.018) and metastatic settings (log-rank test P = 0.027). Patients with cholesterogenic tumors had the longest median survival. KRAS and MYC-amplified tumors had higher expression of glycolytic genes than tumors with normal or lost copies of the oncogenes (Wilcoxon rank sum test P = 0.015). Glycolytic tumors had the lowest expression of mitochondrial pyruvate carriers MPC1 and MPC2. Glycolytic and cholesterogenic gene expression correlated with the expression of prognostic PDAC subtype classifier genes.
Metabolic classification specific to glycolytic and cholesterogenic pathways provides novel biological insight into previously established PDAC subtypes and may help develop personalized therapies targeting unique tumor metabolic profiles.
See related commentary by Mehla and Singh,
Pancreatic ductal adenocarcinoma (PDAC) has one of the lowest survival rates of all cancers due in part to a limited knowledge of clinically relevant tumor subtypes that would facilitate better treatment stratification and the development of new therapies targeting unique molecular signatures. Tumor metabolic heterogeneity contributes to clinical outcome in cancer and represents a potential avenue for the development of personalized treatment strategies. How alterations in distinct metabolic pathways influence PDAC outcome is not well known. We profiled the expression of glycolytic and cholesterogenic genes in 325 resectable and non-resectable PDAC patients and identified distinct subgroups associated with differences in survival and known prognostic pancreatic tumor subtypes. Our findings demonstrate that distinct metabolic gene expression pathways may provide a functional correlate to transcriptome-based pancreatic cancer subtypes, which may enable the development of subtype-specific treatment strategies targeting unique metabolic vulnerabilities.
Introduction
The 5-year survival rate in pancreatic ductal adenocarcinoma (PDAC) is less than 10% and remains one of the lowest in all cancers. Effective therapy is limited by the treatment-refractory nature of PDAC and a short supply of clinically validated biomarkers capable of predicting treatment response (1). Emerging molecular subtypes of PDAC have defined intertumoral heterogeneity at the genome and transcriptome levels (2–6), driving efforts to identify clinically relevant biomarker signatures and actionable genomic alterations (7, 8). However, a better understanding of how specific cellular tumor progression pathways contribute to PDAC prognostic stratification is needed to enable customized treatment design and novel therapeutics development.
Oncogene-driven metabolic adaptations allow cancer cells to survive and thrive in the tumor microenvironment (9). A pan-cancer analysis of global metabolic pathways showed that tumor metabolic heterogeneity is associated with survival, somatic driver mutations, and tumor subtypes (10), but whether heterogeneity in distinct metabolic pathways can be used to stratify PDAC into clinically relevant subgroups has not been well established. A vast majority of PDACs harbor oncogenic KRAS and loss-of-function TP53 mutations (6), in addition to prevalent hypoxia (11), which are known inducers of the glycolytic pathway in cancer (12–15), and glycolysis contributes to tumor progression and chemoresistance in PDAC (13, 16, 17). The effects of glycolysis on tumor progression can be diminished by diverting the metabolite pyruvate from conversion to lactate in part through transport into the mitochondria via the activity of the mitochondrial pyruvate complex (MPC), comprised of pyruvate carrier 1 and 2 (MPC1 and MPC2; refs. 18–20). Reduced MPC activity is associated with poor prognosis in some cancer types (20). Pyruvate is a metabolic intermediate for the tricarboxylic cycle, providing the precursor citrate for lipogenesis including cholesterol and free fatty acid biosynthesis (9, 21). Oncogene-induced activation of the mevalonate pathway, which is essential for de novo cholesterol synthesis and contributes to tumor growth (22), supports the use of pathway inhibitors such as statins in cancer. However, studies on the association of statins with cancer risk or survival have produced mixed results (23–26), and statin response heterogeneity may be linked to distinct tumor molecular signatures (22, 24, 27). The association of MPC1 and MPC2 expression with cancer outcomes (20) raises the possibility that intertumoral differences in pyruvate flux and the balance between glycolysis and cholesterol synthesis could regulate tumor aggressiveness. PDAC cell lines have distinct glycolytic and lipogenic profiles which affect their response to metabolic agents (28); however, whether gene expression heterogeneity in discrete metabolic pathways influences clinical outcome or underlies actionable metabolic vulnerabilities in PDAC is not completely understood.
Here, we stratify PDAC into subgroups based on the expression patterns of glycolytic and cholesterogenic genes, and report their association with survival, mutational, and prognostic gene expression signatures.
Materials and Methods
Patients were enrolled in the ongoing Prospectively Defining Metastatic Pancreatic Ductal Adenocarcinoma Subtypes by Comprehensive Genomic Analysis (PanGen, NCT02869802), the BC Cancer Personalized OncoGenomics program (POG, NCT02155621), and Comprehensive Molecular Characterization of Advanced PDAC For Better Treatment Selection (COMPASS, NCT02750657) studies at the BC Cancer Agency (PanGen, POG) and Ontario Institute for Cancer Research (COMPASS) as described previously (7, 29). The PanGen and POG studies were approved by the University of British Columbia Research Ethics Committee (REB# H12-00137, H14-00681, H16-00291) and the COMPASS study was approved by the University Health Network Research Ethics Board (REB# 15-9596). The studies were conducted in accordance with international ethical guidelines. Written informed consent was obtained from each patient prior to genomic profiling.
Whole genome and transcriptome sequencing
POG and PanGen samples were subjected to whole genome and transcriptome sequencing as described previously (30). Briefly, fresh tumor biopsies were sequenced to a depth of approximately 80×, with approximately 200 million reads generated for transcriptomes. RNA sequencing (RNA-seq) libraries were prepared using inactive magnetic bead-based mRNA purification. RNA-seq was performed on COMPASS samples as described previously (7).
TCGA (PAAD-US) and ICGC (PACA-CA) data
Normalized RNA-seq data (sequence-based gene expression; GRCh37) for all available PAAD-US (n = 142) and PACA-CA (n = 234) samples were downloaded from the ICGC data portal (dcc.icgc.org/) on November 8, 2018 (ICGC data release 27). PACA-CA samples were filtered to exclude any samples labeled as cell lines, xenografts, metastatic, normal, or non-laser microdissected enriched. PAAD-US samples were filtered to exclude non-PDAC samples as outlined in a previous study (6).
Somatic mutation data [those with both copy number variants (CNV) and single nucleotide variants/indels (SNV/indels) available; GRCh37] for all filtered samples with RNA-seq data available (PAAD-US n = 60, PACA-CA n = 86) were downloaded from the ICGC data portal on November 8, 2018.
RNA-seq data processing
POG RNA-seq data were aligned (GRCh37) as described previously (30). COMPASS RNA-seq reads were trimmed to 75 bp using fastx (hannonlab.cshl.edu/fastx_toolkit/; parameters: -l 75 -Q33) and aligned to GRCh37 using BWA-mem v.0.7.6 (31) and JAGuaR v.2.2 (default parameters; ref. 32). Raw read counts for POG and COMPASS samples were assigned to Ensembl 75 genes using Subread v.1.4.6 (parameters: -T 3 -s 1 -C -t ‘gene‘; ref. 33). POG and COMPASS gene expression values were RPKM normalized and log-transformed (log10(RPKM+1)). PAAD-US normalized gene expression values were converted to transcripts per million (TPM) and log-transformed (log10((normalized_count*1e6)+1)). PACA-CA normalized gene expression values were log-transformed (log10(normalized_count +1)). All samples were filtered to exclude those with tumor content values <30%.
Batch correction
Data from POG, COMPASS, PAAD-US, and PACA-CA cohorts were batch-corrected using gene-wise location scaling within each cohort (34). Principal component analysis of the top 25% (n = 4,534) most variable genes confirmed a reduction in between-sample batch effects after normalization (Supplementary Fig. S1).
Metabolic subgrouping
Genes belonging to molecular signatures database (mSigDB; ref. 35) gene sets “REACTOME_GLYCOLYSIS” (n = 29) and “REACTOME_CHOLESTEROL_BIOSYNTHESIS” (n = 24) were used as glycolytic and cholesterogenic genes, respectively. Consensus clustering was performed on glycolytic and cholesterogenic genes using ConsensusClusterPlus (36) v1.38 (parameters: reps = 100, pItem = 0.8, pFeature = 1). Ward.D2 and Euclidean distances were used as the clustering algorithm and distance metric, respectively, with k = 3. Median expression levels of coexpressed glycolytic and cholesterogenic genes were used to assign quiescent (glycolytic ≤ 0, cholesterogenic ≤ 0), glycolytic (glycolytic > 0, cholesterogenic ≤ 0), cholesterogenic (glycolytic ≤ 0, cholesterogenic > 0), and mixed (glycolytic > 0, cholesterogenic > 0) metabolic subgroups to each sample.
Classification of preexisting PDAC subtypes
Samples were classified according to Collisson (3), Bailey (2), and Moffitt (4) subtypes using consensus clustering, as outlined by a previous study (7). Collisson subtyping was based on the 62 gene signature in the original publication (3). Bailey subtyping was based on genes from differential expression analysis results from the original publication (2), which were filtered for genes with an adjusted P < 0.05 and log2 fold change > 0, resulting in 240 ADEX, 1,061 squamous, 268 progenitor, and 370 immunogenic genes. Moffitt subtyping was based on genes belonging to the 50 gene signature in the original publication (4). For each subtyping procedure, samples underwent consensus clustering based on each classifiers genes, followed by semi-automatic subtype assignment based on gene expression patterns (7).
MPC1/2 analysis
When comparing MPC1/2 mRNA levels between metabolic subtypes, Levene and Bartlett tests confirmed that differences in variance were not statistically significant (P < 0.05) between groups, and Shapiro–Wilk tests followed by BH test correction confirmed that MPC1/2 expression values within each group was not significantly (adjusted P < 0.05) different from a normal distribution. Levene, Bartlett, Shapiro–Wilk, one-way ANOVA, and Tukey honestly significant difference (HSD) tests were performed in R v3.3.2.
To identify genes positively and negatively correlated with MPC1/2 expression levels, all genes assayed by RNA-seq (n = 16,733) were then tested for correlation (Spearman) with either MPC1 or MPC2, and P values were subjected to Benjamini–Hochberg (BH) multiple test correction. Genes were identified as being positively or negatively correlated with both MPC1/2 if correlations with both genes were significant (threshold of adjusted P < 0.01) and had ρ > 0 (n = 713) or ρ < 0 (n = 303), respectively.
To identify pathways enriched among genes positively and negatively correlated with both MPC1/2, we performed a comprehensive gene set enrichment analysis (GSEA) on both groups of genes. GSEA was performed in R using hypergeometric tests followed by BH multiple test correction, and all 18,026 gene sets downloaded from mSigDB (35) were tested.
Calculation of tumor content
For POG samples, a novel statistical modeling algorithm was used to determine tumor purity from whole genome sequencing data (Culibrk and colleagues., in preparation). Briefly, the germline genomes were divided into segments with equal coverage at a threshold. Next, somatic read counts within these bins were enumerated and clusters were identified by univariate density approximation following kernel density estimation. Each cluster corresponded to a distinct copy number state within the genome. We generated models that described alternate copy number fits for each set of clusters. We then fitted a linear model to each set of selected clusters and computed the penalty for each model. The penalty is an empirically derived function of the standard error of fit, proportion of data explained by fit, and the relative proportion of predicted versus observed copy number states. Next, allelic frequencies of heterozygous germline SNPs within the selected clusters were used to determine the absolute copy number of each cluster. Assuming that all reads mapping to homozygously deleted regions originate from normal tissue contamination, the number of reads mapping to homozygous regions was proportional to the normal contamination. This value was used to compute tumor content. When tumor content was not able to be predicted computationally, the pathology-measured value was used.
Tumor content values for COMPASS and PACA-CA samples were determined as described previously (7). Tumor content (ABSOLUTE; ref. 37) for PAAD-US samples were downloaded from the GDC data portal on February 1, 2016. For the pan-TCGA analysis, tumor content values were obtained from a previous publication (38).
Mutation analysis
All mutation data were derived from hg19. SNV/indels and CNVs in POG, COMPASS, and PACA-CA samples were identified as described previously (7, 30). Relative to tumor ploidy, DNA segments with copy state ≥ 4 and ≤1 were considered amplifications and deletions, respectively. PAAD-US mutation data were downloaded February 1, 2016, from the GDC data portal. PAAD-US copy number events were filtered for those with at least 10 supporting probes and a segment mean >0.2 (amplifications) or <−0.2 (deletions), as recommended by a previous study (39). Coordinates of copy number events were mapped to gene coding regions using Bedtools v2.26. For contingency analyses, SNVs and CNVs were tested individually for each gene. For each subgroup, each of the 12 genes were tested, computing a Fisher exact test to determine whether loss-of-function mutations or copy number amplifications/deletions were enriched in that subtype. Resulting P values were subjected to BH test correction.
Pan-TCGA RNA-seq analysis
RNA-seq data [RNA-seq by expectation maximization (RSEM); GRCh37] for all non-PAAD TCGA samples was downloaded from the GDC data portal on November 23, 2015. Samples were filtered for those belonging to cancer types with at least 100 samples, leaving 17 cancer types. Expression values were log-transformed (log10(RSEM+1)) and batch correction was applied using gene-wise location scaling within each cancer type.
For each cancer type individually, we repeated consensus clustering (ConsensusClusterPlus, parameters: reps = 100, pItem = 0.8, pFeature = 1; Ward.D2 and Euclidean distance, k = 3) using expression values of genes belonging to the “REACTOME_GLYCOLYSIS” and “REACTOME_CHOLESTEROL_BIOSYNTHESIS” gene sets. For each cluster, the proportion of glycolytic and cholesterogenic genes was calculated, and clusters were considered “core” clusters if they consisted of >50% of either gene set. For cancer types with more than one core cluster of the same gene set, the most homogenous cluster was considered core. Cancer types that did not have core glycolytic and cholesterogenic clusters of at least 75% homogeneity were omitted from further analysis (BRCA, CESC, KIRP, PRAD, SKCM, and UCEC), leaving 9 cancer types (Supplementary Fig. S2). Metabolic subtypes were determined for each individual cancer type based on median values of their respective core glycolytic and cholesterogenic genes.
Survival analysis
Sequencing data availability
Genomic data generated within the POG and COMPASS studies are being submitted to the European Genome-phenome Archive (EGA) under accession numbers #EGAS00001001159 and #EGAS00001002543, respectively.
Results
Dual analysis of glycolytic and cholesterogenic gene expression identifies four distinct subgroups of PDAC
To stratify PDAC tumors based on their relative expression levels of glycolytic and cholesterol synthesis pathway genes, we utilized RNA-seq data from resectable and nonresectable PDAC patient tumors. The resectable datasets included TCGA PAAD-US and ICGC PACA-CA. The non-resectable cohort studies included COMPASS, PanGen and POG. To enrich for tumor cell-specific mRNA, samples were filtered to exclude those with tumor content < 30% (Supplementary Fig. S3), leaving a total of 325 patient samples (TCGA n = 61, ICGC n = 148, COMPASS n = 90, PanGen/POG n = 26). Genes belonging to Reactome gene sets “glycolysis” (n = 29) and “cholesterol biosynthesis” (n = 24) were selected for analysis. Previous studies have demonstrated heterogeneity in metabolic gene expression, including isoenzymes within specific pathways, between different cancer types (10, 42). To aid in selecting genes co-regulated within each pathway and relevant to PDAC biology, we used consensus clustering to identify two groups of robustly co-expressed glycolysis (n = 14) and cholesterol synthesis (n = 15) pathway genes to be used for metabolic subtyping (Fig. 1A). Median expression levels of coexpressed glycolytic and cholesterogenic genes were calculated for each sample and used in assigning one of four metabolic profiles specifically relevant to these two pathways: quiescent, glycolytic, cholesterogenic and mixed (Fig. 1B). Expression levels of glycolytic and cholesterogenic genes across the metabolic subgroups are visualized in Fig. 1C. The quiescent phenotype defined the largest group of cases (101/325; 31.1%), followed by mixed (79/325; 24.3%), cholesterogenic (73/325; 22.5%) and glycolytic (72/325; 22.2%). Differences in the proportion of samples belonging to each subtype were not statistically significant (Fisher exact test P = 0.15) between resectable and metastatic samples. In order to determine if stroma type impacts the metabolic classification, we performed clustering analysis of the cases using normal and activated PDAC stroma gene signatures (Supplementary Fig. S4; ref. 4). There were no significant differences in the distribution of metabolic subgroups across the two stroma subtypes. The glycolytic profile was associated with the shortest median survival in both resectable (log-rank test P = 0.018) and metastatic (log-rank test P = 0.027) PDAC (Fig. 1D), consistent with the role of glycolysis in tumor progression (9). Interestingly, a survival benefit was observed in cases with increased expression of cholesterol synthesis genes. Cholesterogenic cases had the longest median overall survival in the resectable (log-rank test P = 0.0031 vs. glycolytic, P = 0.043 vs. mixed, P = 0.025 vs. quiescent) and metastatic (log-rank test P = 0.011 vs. glycolytic) groups. Mixed cases had a significantly better outcome than glycolytic cases in the metastatic group (log-rank test P = 0.039). Cholesterogenic cases had the longest relapse interval in resected PDAC (Supplementary Fig. S5). Metabolic gene expression reprogramming has been associated with changes in the relevant metabolites (10). Our results indicate that there are multiple metabolic phenotypes relevant to the glycolysis-cholesterol synthesis axis in PDAC, where tumors with higher rates of glycolysis but lower cholesterol synthesis may be more aggressive or less sensitive to chemotherapy than tumors with a more cholesterogenic phenotype.
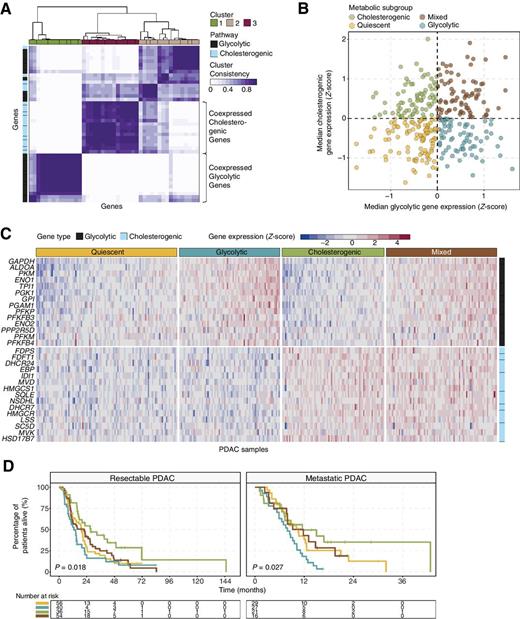
Stratification of PDAC tumors based on expression of glycolytic and cholesterogenic genes. A, Heatmap depicting consensus clustering solution (k = 3) for glycolytic and cholesterogenic genes in resected and metastatic PDAC samples (n = 325). B, Scatter plot showing median expression levels of coexpressed glycolytic (x-axis) and cholesterogenic (y-axis) genes in each PDAC sample. Metabolic subgroups were assigned on the basis of the relative expression levels of glycolytic and cholesterogenic genes. C, Heatmap depicting expression levels of coexpressed glycolytic and cholesterogenic genes across each subgroup. D, Kaplan–Meier survival analysis of patients with resectable (left) and metastatic (right) PDAC stratified by metabolic subgroup. Log-rank test P values are shown.
Stratification of PDAC tumors based on expression of glycolytic and cholesterogenic genes. A, Heatmap depicting consensus clustering solution (k = 3) for glycolytic and cholesterogenic genes in resected and metastatic PDAC samples (n = 325). B, Scatter plot showing median expression levels of coexpressed glycolytic (x-axis) and cholesterogenic (y-axis) genes in each PDAC sample. Metabolic subgroups were assigned on the basis of the relative expression levels of glycolytic and cholesterogenic genes. C, Heatmap depicting expression levels of coexpressed glycolytic and cholesterogenic genes across each subgroup. D, Kaplan–Meier survival analysis of patients with resectable (left) and metastatic (right) PDAC stratified by metabolic subgroup. Log-rank test P values are shown.
Association of metabolic subtypes with tumor genomic profiles and known PDAC subtypes
Molecular events such as oncogenic mutant KRAS and MYC amplification, and mutations in TP53 are capable of driving metabolic reprogramming in cancers including PDAC (13, 43, 44). To determine oncogenic events across the different metabolic subtypes, we investigated the frequency of SNV, indels, and CNV affecting genes frequently mutated in PDAC (2, 6, 7) across the metabolic subtypes (Fig. 2A). Although differences in the frequency of mutations in each gene were not significantly different across subtypes (Fisher exact test with BH test correction, adjusted P > 0.05), we noted a significant increase in median glycolytic gene expression in samples with both KRAS and MYC amplification (Wilcoxon rank sum test P = 0.015; Fig. 2B). There was a moderate correlation of the expression of glycolytic genes with KRAS (Spearman correlation ρ = 0.27, P = 6.6e−7) and a weak correlation with MYC (Spearman correlation ρ = 0.15, P = 0.007) expression (Fig. 2C). These findings are compatible with the notion that KRAS and MYC drive tumor metabolism toward glycolysis in PDAC and suggest that tumors with KRAS and MYC copy gain may be more dependent on glucose utilization and vulnerable to glycolytic inhibition.
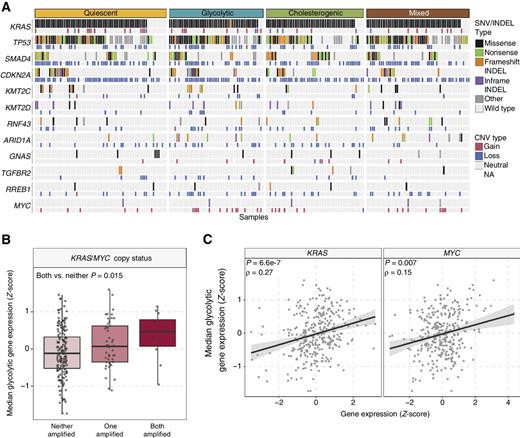
Mutational landscape across metabolic subgroups of PDAC. A, Oncoprint depicting the distribution of somatic mutation (SNV/indel) and copy number variation (CNV) events affecting frequently mutated genes in PDAC across the metabolic subtypes. B, Box plot illustrating median expression of glycolytic genes in samples with KRAS and/or MYC copy number amplification. C, Scatter plot depicting the correlation between median glycolytic gene expression and KRAS (left) and MYC (right) expression.
Mutational landscape across metabolic subgroups of PDAC. A, Oncoprint depicting the distribution of somatic mutation (SNV/indel) and copy number variation (CNV) events affecting frequently mutated genes in PDAC across the metabolic subtypes. B, Box plot illustrating median expression of glycolytic genes in samples with KRAS and/or MYC copy number amplification. C, Scatter plot depicting the correlation between median glycolytic gene expression and KRAS (left) and MYC (right) expression.
Gene expression analysis of other PDAC metabolic reprogramming drivers revealed increased expression of HIF1A and associated glycolysis genes LDHA and SLC16A3 in the glycolytic group and increased expression of the sterol synthesis transcriptional activator SREBF2 in the cholesterogenic group (Supplementary Fig. S6). The expression of PRKAA1, which encodes one of the catalytic subunits of AMP-activated protein kinase (AMPK), was reduced in glycolytic tumors. The cholesterogenic tumors had reduced expression of AKT2 and AKT3, as well as GLS, the gene encoding glutaminase. This indicates that components of the PI3K/AMPK and glutamine metabolism pathways are uniquely dysregulated in glycolytic and cholesterogenic tumors. PDAC has been associated with reduced uptake and utilization of branched-chain amino acids (45) and KRAS-dependent upregulation of the pentose phosphate and nucleotide metabolism pathways (13). Analysis of these networks demonstrated reduced expression of genes involved in amino acid catabolism, nucleotide metabolism and pentose phosphate pathways in the quiescent subgroup (Supplementary Fig. S7), suggesting that these tumors may overall represent a PDAC subtype with low metabolic activity.
Previous studies have identified PDAC gene expression signatures associated with survival (2–4). Subtypes associated with poor outcome include the basal-like (Moffitt and colleagues; ref. 4), squamous (Bailey and colleagues; ref. 2), and quasi-mesenchymal (Collisson and colleagues; ref. 3) classifications. To investigate whether expression patterns across the glycolytic-cholesterogenic axis could underlie the differences between previously established subtypes, we determined the various PDAC subtypes for each sample (7) and investigated their degree of overlap with the metabolic phenotypes (Fig. 3A). The quiescent group included predominantly classical (Moffitt and colleagues) cases (72.3%) and contained the highest frequency (Fisher's exact test with BH test correction) of ADEX (17.8%, adjusted P = 0.015) and exocrine-like (23.8%, adjusted P = 4.9e-3) cases (Fig. 3B). The Collisson and colleagues' exocrine-like signature is associated with high expression of genes encoding digestive enzymes (3), suggesting that the quiescent group may include a higher proportion of cases with a distinct cell type of origin, specifically those involved in digestive enzyme secretion. Consistent with the glycolytic phenotype conferring the worst outcome, the majority of these cases were basal-like (62.5%, adjusted P = 9.6e−11), squamous (58.3%, adjusted P = 6.3e−12) and quasi-mesenchymal (59.7%, adjusted P = 2.3e−10). The cholesterogenic subgroup was characterized by the lowest proportion of either of the poor prognosis signatures (basal-like: 5.5%, adjusted P = 4.9e−7; quasi-mesenchymal: 5.5%, adjusted P = 2.1e−6; squamous: 2.7%, adjusted P = 6.2e−7), and highest proportion of progenitor cases (83.6%, adjusted P = 1.9e−5). This finding is in line with the progenitor subtype reported to be enriched in genes involved in steroid hormone biosynthesis (2), a pathway downstream of cholesterol synthesis. Glycolytic gene expression was positively correlated with Moffit and colleagues' basal-like genes (Spearman correlation ρ = 0.42, P = 2.7e−15), while negatively correlated with Moffit and colleagues' classical genes (Spearman correlation ρ = −0.28, P = 3.6e−7; Fig. 3C). In contrast, cholesterogenic gene expression was positively correlated with Moffit and colleagues' classical genes (Spearman correlation ρ = 0.35, P = 1.2e−10), and showed a weak negative correlation with Moffit and colleagues' basal-like genes (Spearman correlation ρ = −0.15, P = 0.006). Taken together, these data implicate a role for distinct tumor metabolism pathways as mechanisms contributing to the prognostic effects of the known PDAC subtypes, and identify glycolysis and cholesterol synthesis as potential targetable metabolic vulnerabilities in the different subtypes.

Alignment of PDAC metabolic subgroups with known gene expression subtypes. A, Overlay of metabolic profiles (inner ring) with PDAC expression subtypes (outer rings) based on the Moffitt and colleagues' (4), Bailey and colleagues' (2), and Collisson and colleagues' (3) classifications. B, Bar plots illustrating the proportion of PDAC expression subtypes across each metabolic subgroup. C, Scatter plot depicting reciprocal correlations between expression of glycolytic and cholesterogenic genes and genes associated with the Moffitt and colleagues' (4) basal-like and classical subtypes.
Alignment of PDAC metabolic subgroups with known gene expression subtypes. A, Overlay of metabolic profiles (inner ring) with PDAC expression subtypes (outer rings) based on the Moffitt and colleagues' (4), Bailey and colleagues' (2), and Collisson and colleagues' (3) classifications. B, Bar plots illustrating the proportion of PDAC expression subtypes across each metabolic subgroup. C, Scatter plot depicting reciprocal correlations between expression of glycolytic and cholesterogenic genes and genes associated with the Moffitt and colleagues' (4) basal-like and classical subtypes.
MPC complex as a potential regulator of the tumor glycolysis–cholesterol synthesis axis
The MPC complex regulates mitochondrial pyruvate flux and suppression of MPC1 and MPC2 expression in cancer cells promotes tumor glycolytic activity and lactate generation (20). To investigate the relationship between MPC1 and MPC2 and the glycolytic and cholesterogenic phenotypes, we compared mutation frequencies and expression levels of both genes across the metabolic subgroups. We noted a paradoxical relationship between CNVs in each gene, with CNVs affecting MPC1 being exclusively deletions while the majority (16/17) of CNVs affecting MPC2 were amplifications (Fig. 4A). The expression levels of both MPC1 and MPC2 were found to be significantly different (one-way ANOVA P = 6.7e−4 and 8.8e−9, respectively) across metabolic subgroups. Both MPC1 and MPC2 gene expression was significantly reduced in glycolytic samples compared with each of the other groups (Tukey's honestly significant differences (HSD) test adjusted P < 0.01) and the expression of MPC2 was significantly increased in cholesterogenic cases compared to quiescent samples (Tukey HSD test adjusted P = 0.006; Fig. 4B), suggesting that dysregulation of mitochondrial pyruvate transport at the mRNA level may contribute to the metabolic tumor subtypes. Consistent with the hypothesis that cytoplasmic pyruvate is shuttled toward lactate generation in glycolytic tumors, LDHA levels were higher in tumors with increased expression of glycolytic genes (Supplementary Fig. S6).
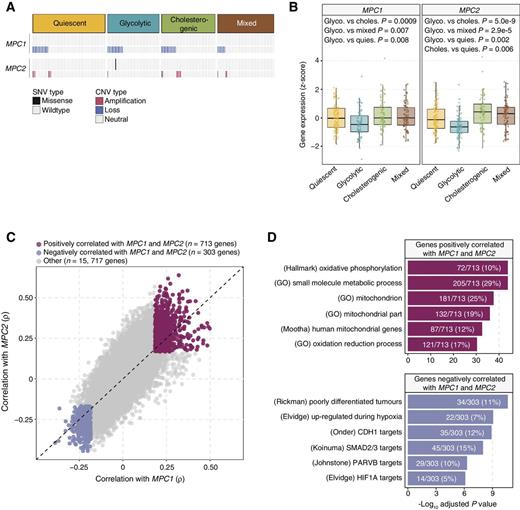
Association of MPC1 and MPC2 expression with PDAC metabolic subgroups and cell signaling pathways. A, Oncoprint showing the distribution of MPC1 and MPC2 SNVs and CNVs across the metabolic groups. Only one case was found with an SNV in MPC2. B, Box plots illustrating significant (one-way ANOVA P < 0.001) differences in expression levels of MPC1 and MPC2 across PDAC metabolic subgroups. Glycolytic cases have the lowest levels of MPC1 and MPC2 mRNA (Tukey HSD test adjusted P < 0.05). C, Scatter plot depicting the correlations between MPC1 (x-axis) and MPC2 (y-axis) and each of 16,733 genes. A total of 713 and 303 genes were found to be positively (Spearman correlation BH-adjusted P < 0.01; ρ > 0) and negatively (adjusted P < 0.01; ρ < 0) correlated with both MPC1 and MPC2 expression, respectively. D, Top 6 most significantly enriched (hypergeometric test BH-adjusted P < 0.05) gene sets among genes positively (top) and negatively (bottom) associated with MPC1/2 expression. Genes negatively associated with MPC1/2 are enriched for gene sets related to hypoxia and cell adhesion.
Association of MPC1 and MPC2 expression with PDAC metabolic subgroups and cell signaling pathways. A, Oncoprint showing the distribution of MPC1 and MPC2 SNVs and CNVs across the metabolic groups. Only one case was found with an SNV in MPC2. B, Box plots illustrating significant (one-way ANOVA P < 0.001) differences in expression levels of MPC1 and MPC2 across PDAC metabolic subgroups. Glycolytic cases have the lowest levels of MPC1 and MPC2 mRNA (Tukey HSD test adjusted P < 0.05). C, Scatter plot depicting the correlations between MPC1 (x-axis) and MPC2 (y-axis) and each of 16,733 genes. A total of 713 and 303 genes were found to be positively (Spearman correlation BH-adjusted P < 0.01; ρ > 0) and negatively (adjusted P < 0.01; ρ < 0) correlated with both MPC1 and MPC2 expression, respectively. D, Top 6 most significantly enriched (hypergeometric test BH-adjusted P < 0.05) gene sets among genes positively (top) and negatively (bottom) associated with MPC1/2 expression. Genes negatively associated with MPC1/2 are enriched for gene sets related to hypoxia and cell adhesion.
To search for cellular pathways associated with MPC1/2 expression, we performed a comprehensive correlation analysis between MPC1/2 and all other genes assayed (n = 16,733). A total of 713 and 303 genes were positively and negatively (Spearman correlation BH-adjusted P < 0.01) correlated with MPC1/2, respectively (Fig. 4C, Supplementary Table S1). GSEA of positively correlated genes revealed significant association (hypergeometric test, BH-adjusted P < 0.05) with the oxidative phosphorylation pathway. Pathways enriched among negatively correlated genes included those involved in poorly differentiated tumors (adjusted P = 2.3e−11), hypoxia (adjusted P = 8.5e−10), TGFβ signaling (adjusted P = 1.0e−8) and E-cadherin activity (adjusted P = 1.3e−9; Fig. 4D, Supplementary Tables S2 and S3). These data suggest that MPC activity is involved in cellular networks associated with tumor progression in PDAC, possibly in part by influencing the balance between tumor glycolytic and cholesterogenic activity.
Relevance of glycolytic and cholesterogenic gene clusters in other cancer types
Different cancer types have unique metabolic signatures driven by mutational landscape and organ-specific enzyme expression, which may influence outcomes (10, 42). To determine the relevance of glycolytic and cholesterogenic gene expression subtyping in other organ sites, we repeated the consensus clustering analysis of glycolytic and cholesterogenic gene expression in 17 TCGA cancer types (7,375 samples with tumor content ≥ 30%; ref. 38). We found discrete clusters of coexpressed pathway-specific genes in 9 cancer types (Supplementary Fig. S2). Although many of the genes were consistently coexpressed in most tumor types, the appearance of some genes in coexpressed glycolytic and cholesterogenic pathways was unique to only a few cancers, indicating cell type-specific contributions of some genes to the metabolic programs in each cancer (Fig. 5A). Glycolytic gene expression showed significant (Spearman correlation BH-adjusted P < 0.05) positive correlation with the expression of basal-like genes from the Moffitt and colleagues' PDAC classification system (4) in all cancer types, demonstrating that the basal-like gene signature is also associated with increased glycolytic activity across a greater spectrum of tumor types (Fig. 5B). For some cancer types, we also found a positive correlation (BH-adjusted P < 0.05) between median glycolytic gene expression and either KRAS (LGG, COAD, LUSC) or MYC (GBM, HNSC, LUAD, BLCA, LUSC) expression. Similar to PDAC, the expression of either MPC1 (HNSC, LUSC) or MPC2 (BLCA, COAD), or both (LUAD), was significantly (Wilcoxon rank sum test, BH-adjusted P < 0.05) attenuated (fold change < 0) in the glycolytic groups (Fig. 5B), further strengthening the notion that changes in mRNA levels of these genes contributes to tumor glycolysis. Significant differences in survival across the four metabolic subtypes were observed in LGG (log-rank P = 0.0076) and LIHC (P = 0.018, Fig. 5C). In LGG, subtypes with low expression of cholesterogenic genes had shorter survival times than those with higher expression of cholesterogenic genes (median overall survival: quiescent: 63.5 months, glycolytic: 73.5 months, cholesterogenic: 95.6 months, mixed: 146.1 months). In LIHC, the difference in survival was observed across the glycolytic but not cholesterogenic gene expression gradient with glycolytic and mixed cases having inferior outcome (median overall survival: quiescent: 80.7 months, glycolytic: 41.8 months, cholesterogenic: 70.1 months, mixed: 45.1 months). These results indicate that tumor metabolic dependencies may differ according to distinct genomic signatures and tumor microenvironment factors that are specific to cancer type. For example, driver mutations in IDH1 and IDH2 encoding metabolic enzymes are prevalent in LGG, which may uniquely affect cell metabolism and tumor progression.
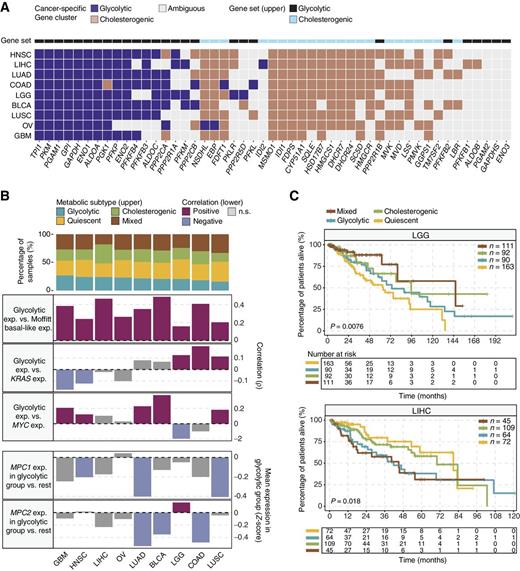
Glycolytic and cholesterogenic gene profiling of other cancer types. A, Heatmap depicting which glycolytic and cholesterogenic genes were robustly coexpressed when consensus clustering was applied to each individual cancer type. B, Bar plots depicting the proportions of metabolic subgroups across the various cancer types (top) and correlation between glycolytic subgroups and expression of basal-like genes (4), KRAS, MYC, and MPC1/2 in each cancer type (bottom). Median glycolytic gene expression was positively (Spearman ρ > 0, BH-adjusted P < 0.05) correlated with basal-like gene expression in all cancer types. The correlation between MPC1/2 expression and the glycolytic subgroup was measured using Wilcoxon rank sum tests followed by BH correction. C, Kaplan–Meier survival analysis curves showing differences in median overall survival across metabolic subgroups in LGG (log-rank P = 0.0076) and LIHC (P = 0.018).
Glycolytic and cholesterogenic gene profiling of other cancer types. A, Heatmap depicting which glycolytic and cholesterogenic genes were robustly coexpressed when consensus clustering was applied to each individual cancer type. B, Bar plots depicting the proportions of metabolic subgroups across the various cancer types (top) and correlation between glycolytic subgroups and expression of basal-like genes (4), KRAS, MYC, and MPC1/2 in each cancer type (bottom). Median glycolytic gene expression was positively (Spearman ρ > 0, BH-adjusted P < 0.05) correlated with basal-like gene expression in all cancer types. The correlation between MPC1/2 expression and the glycolytic subgroup was measured using Wilcoxon rank sum tests followed by BH correction. C, Kaplan–Meier survival analysis curves showing differences in median overall survival across metabolic subgroups in LGG (log-rank P = 0.0076) and LIHC (P = 0.018).
Discussion
Continuous progress in the understanding of clinically relevant tumor subtypes is needed to accelerate the development of personalized treatment in PDAC. We show that PDAC tumors have distinct metabolic profiles based on the expression of genes involved in glycolysis and cholesterol synthesis, which influence disease outcome and provide functional context to previously identified gene expression subtypes.
There is significant molecular heterogeneity in PDAC giving rise to distinct tumor subclasses based on structural variations, chromosomal rearrangement events, epigenetic modification and gene expression signatures (2–6), leading to a growing interest into translating this information into clinical practice for outcome prognostication and treatment response prediction, as well as the development of personalized therapies based on each tumor's unique molecular signature. PDAC transcriptome subtypes are associated with survival (2–4, 6), but have yet to make a significant impact on clinical management and the development of new treatment strategies. The association between glycolytic and cholesterogenic gene expression and expression levels of basal-like and classical genes provides a biological significance to PDAC subtypes and supports targeting tumor metabolic plasticity as a means to reprogram an aggressive tumor type.
Glycolysis facilitates tumor progression, immune escape, and chemoresistance (9). The finding that tumors with a glycolytic gene signature were associated with shortest overall survival corroborates the role of glycolysis in tumor aggressiveness in PDAC (16). Cholesterol and its metabolites stimulate cancer cell growth (46) and the tumor suppressor function of AMPK is mediated in part by the suppression of sterol synthesis (47). However, the finding that PDAC cases with increased expression of cholesterogenic genes had better outcome indicates that while both glycolysis and cholesterol synthesis support cancer cell growth, they do not act synergistically to accelerate tumor progression in PDAC. Furthermore, the correlation of gene expression heterogeneity along the glycolysis–cholesterol synthesis axis and prognostic subtypes of PDAC indicates that different therapeutic strategies targeting metabolic vulnerabilities, for example, those targeting tumor dependency on glucose or cholesterol synthesis, could have clinical benefit in subsets of PDAC patients.
A survival benefit associated with the cholesterogenic profile could be an indirect effect due to increased pyruvate shuttling into the mitochondria and reduced lactate production, a known mediator of tumor growth (9). This hypothesis is supported by the observation that the levels of MPC1 and MPC2 were lowest in tumors of the glycolytic subtype. Other potential mechanisms contributing to the outcome in cholesterogenic tumors could involve the anti-tumor effects of cholesterol metabolites and derivatives. Oxysterols are cholesterol metabolites that activate liver-X-receptors (LXR), which were shown to have tumor anti-proliferative and proapoptotic effects (48), and there is currently a clinical trial of an LXR agonist in advanced cancer (NCT02922764). Dendrogenin A is a recently identified cholesterol derivative formed from cholesterol-5,6-epoxides and histamine with LXR activating and antitumor properties (49).
PDAC tumors with both KRAS and MYC amplifications had the highest expression of glycolytic genes, indicating a potential glycolytic dependency and vulnerability to pharmacologic glycolytic inhibition. One treatment strategy to target glycolysis-dependent tumors, such as those with KRAS and MYC amplification, may be to shift the metabolic phenotype towards the activation of the sterol synthesis pathway. The activity of the MPC complex regulates pyruvate distribution in tumor cells (20) and we show that the expression of MPC1 and MPC2 is negatively correlated with cellular gene programs linked to an aggressive tumor phenotype. These findings establish the MPC complex as a potential target for altering tumor metabolic activity, whereby increasing MPC1 and MPC2 activity in glycolytic PDAC cases may reduce the effects of tumor glycolysis by shifting the tumor into a cholesterogenic profile. We observed that MPC1 deletion was a frequent event in PDAC, consistent with other cancer types (20), while MPC2 CNVs were mostly amplified. Although both MPC1 and MPC2 form a functional heterocomplex, MPC2, but not MPC1, can also form independently functional homooligomers (50). Thus, the increased MPC2 expression in the cholesterogenic subtype raises the possibility that increased presence of MPC2 homooligomers may facilitate mitochondrial pyruvate uptake in these tumors. Our results also identify MPC2 as a potential target for stimulating mitochondrial pyruvate transport, which may be particularly relevant in tumors with MPC1 copy loss.
Overall, tumor type-specific metabolic heterogeneity demonstrates that some reprogrammed metabolic pathways are less detrimental than others to clinical outcome depending on the cancer type, which may be exploited for the development of more precise therapeutic strategies targeting unique metabolic dependencies.
Disclosure of Potential Conflicts of Interest
J.J. Laskin reports receiving speakers bureau honoraria from Roche Canada and is an advisory board member/unpaid consultant for Takeda. D.J. Renouf reports receiving speakers bureau honoraria from Celgene, Servier, Taiho, Bayer, and Ipsen. No potential conflicts of interest were disclosed by the other authors.
Authors' Contributions
Conception and design: J.M. Karasinska, J.T. Topham, S.E. Kalloger, D.J. Renouf, D.F. Schaeffer
Development of methodology: J.M. Karasinska, J.T. Topham, S.E. Kalloger, L. Culibrk, A.J. Mungall, D.J. Renouf
Acquisition of data (provided animals, acquired and managed patients, provided facilities, etc.): L.M. Williamson, H.-L. Wong, M.K.C. Lee, G.M. O'Kane, R.A. Moore, A.J. Mungall, M.J. Moore, F. Notta, J.J. Knox, S. Gallinger, J. Laskin, M.A. Marra, D.J. Renouf
Analysis and interpretation of data (e.g., statistical analysis, biostatistics, computational analysis): J.M. Karasinska, J.T. Topham, S.E. Kalloger, G.H. Jang, M.K.C. Lee, M.J. Moore, C. Warren, J. Laskin, M.A. Marra, S.J.M. Jones, D.J. Renouf
Writing, review, and/or revision of the manuscript: J.M. Karasinska, J.T. Topham, S.E. Kalloger, G.H. Jang, R.E. Denroche, H.-L. Wong, M.K.C. Lee, G.M. O'Kane, R.A. Moore, A.J. Mungall, C. Warren, A. Metcalfe, J.J. Knox, S. Gallinger, J. Laskin, S.J.M. Jones, D.J. Renouf, D.F. Schaeffer
Administrative, technical, or material support (i.e., reporting or organizing data, constructing databases): J.T. Topham, R.E. Denroche, G.M. O'Kane, R.A. Moore, A.J. Mungall, M.J. Moore
Study supervision: D.J. Renouf, D.F. Schaeffer
Acknowledgments
We gratefully acknowledge the participation of patients and their families, and the POG and PanGen teams. The results published here are in part based upon data generated by The Cancer Genome Atlas managed by the NCI and NHGRI (http://cancergenome.nih.gov), as well as data generated by the International Cancer Genome Consortium (https://icgc.org/). This research was supported through philanthropic donations received through the BC Cancer Foundation (project B20POG), as well as funding provided by the Terry Fox Research Institute (project 1078), Ontario Institute for Cancer Research (PanCuRx Translational Research Initiative), Pancreatic Cancer Canada and Genome British Columbia. We acknowledge contributions toward equipment and infrastructure from Genome Canada and Genome BC (projects 202SEQ, 212SEQ, 12002), Canada Foundation for Innovation (projects 20070, 30198, 30981, 33408), and the BC Knowledge Development Fund. M.A. Marra acknowledges infrastructure investments from the Canada Foundation for Innovation and the support of the Canada Research Chairs. D.J. Renouf is a recipient of the MSFHR Health Professional-Investigator Award and D.F. Schaeffer is a recipient of the VCHRI Investigator Award.
The costs of publication of this article were defrayed in part by the payment of page charges. This article must therefore be hereby marked advertisement in accordance with 18 U.S.C. Section 1734 solely to indicate this fact.